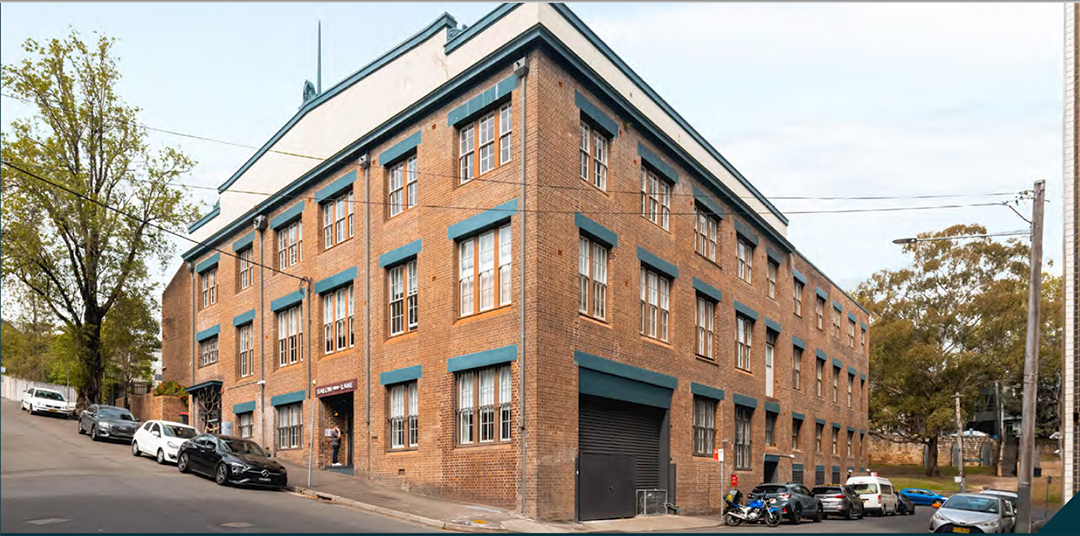
Real Estate Feasibility Analysis Project: 63 Anne St, Surry Hills
I built this to demonstrate a dashboard of quantitative data. I have a backend model that calculates the forecast cashflows for each account in the chart of accounts; Asset, Liability, Income, Expense. From that I can calculate the performance metric Internal Rate of Return (IRR) that is used to compare investments.
This is example is a commercial office space in Surry Hills.

Scenario A
Scenario A, the fully let scenario yields a IRR of 12.5%.
Scenario B
Scenario B including a continuation of the current level of vacancy yields an IRR of 13.4%.
The current level of vacancy as described in the IM is 21% of NLA or 24% of Income.
Comparison
The uplift in Scenario B's IRR can be attributed to the lower purchase price calculated on lower Net Revenue due to the vacancies.
I have calculated IRR Net of Costs not including Taxes.
Scenario A (partial let)
- IRR Total
- 12.5%
63 Ann St, Surry Hills

The fully let Scenario A yields a IRR of 12.5% and Scenario B including a continuation of the current level of vacancy yields an IRR of 13.4%. The current level of vacancy as described in the IM is 21% of NLA or 24% of Income. The uplift in Scenario Bs IRR can be attributed to the lower purchase price calculated on lower Net Revenue due to the vacancies. I have calculated IRR Net of Costs not including Taxes.
Scenario A (partial let)
- IRR Total
- 12.5%
Scenario B (fully let)
- IRR Total
- 13.4%